ZILCAST
Zach's Illinois Forecast (ZILCAST) forecasts Illinois monthly unemployment rate over a 1-12 month horizon. It will include other series. The forecast updates when the next month of data arrives.
Datasets Relied On: BLS time series (sm, la, cu) and the CPS basic monthly.
Method: It's a (frequentist) model-averaging estimator that uses kernel weighting to weight other states and time periods relative to Illinois today.
Stack: The whole workflow is in R, from pulling the data to publishing these webpages. I automate it using vanilla cron on my laptop and the AWS CLI. I keep track of all the model runs on the same tiny Postgres box I dump all my side projects on.
Oh. I'm Zach Flynn (LinkedIn), Economist, Data Scientist, and Illinois resident.
The purpose of ZILCAST is to connect what I do to where I live. To unsever the self from its environment. Something like that.
Download the full CSV (includes all forecast dates).
The variables are:
- run_id. An identifier for the particular estimation run. Usually has the format YYYY_MM_DD_HH_MM for the time the run was kicked off, which is unrelated to the data used in the forecast.
- series. The series being forecast.
- fips. The fips code of the state the forecast is for.
- forward. How many months forward the forecast is. To get the month of the forecast value, you add forward months to the base_date.
- statistic. Whether it is a mean forecast or one of the quantile forecasts.
- base_date. The latest date in the forecast dataset.
- forecast. The value of the forecast.
- fc_id. A unique forecast id. This is a primary key in this output (the latest and greatest version of each forecast).
Series. Unemployment Rate.
Forecast Date. 2026-01-01.
Terms.
- Forecast Date. The latest month included in the forecast data set.
- Date. The date for which we are forecasting the series.
- Actual. The actual value of the series or X if we don't know the actual value yet.
- Mean. The mean forecast.
- QXX. The XX quantile forecast. For example, Q10 is the 10% quantile forecast. The quantile refers to the quantile of historical prediction error. It is not a measure of model or parameter uncertainty. It takes both as given.
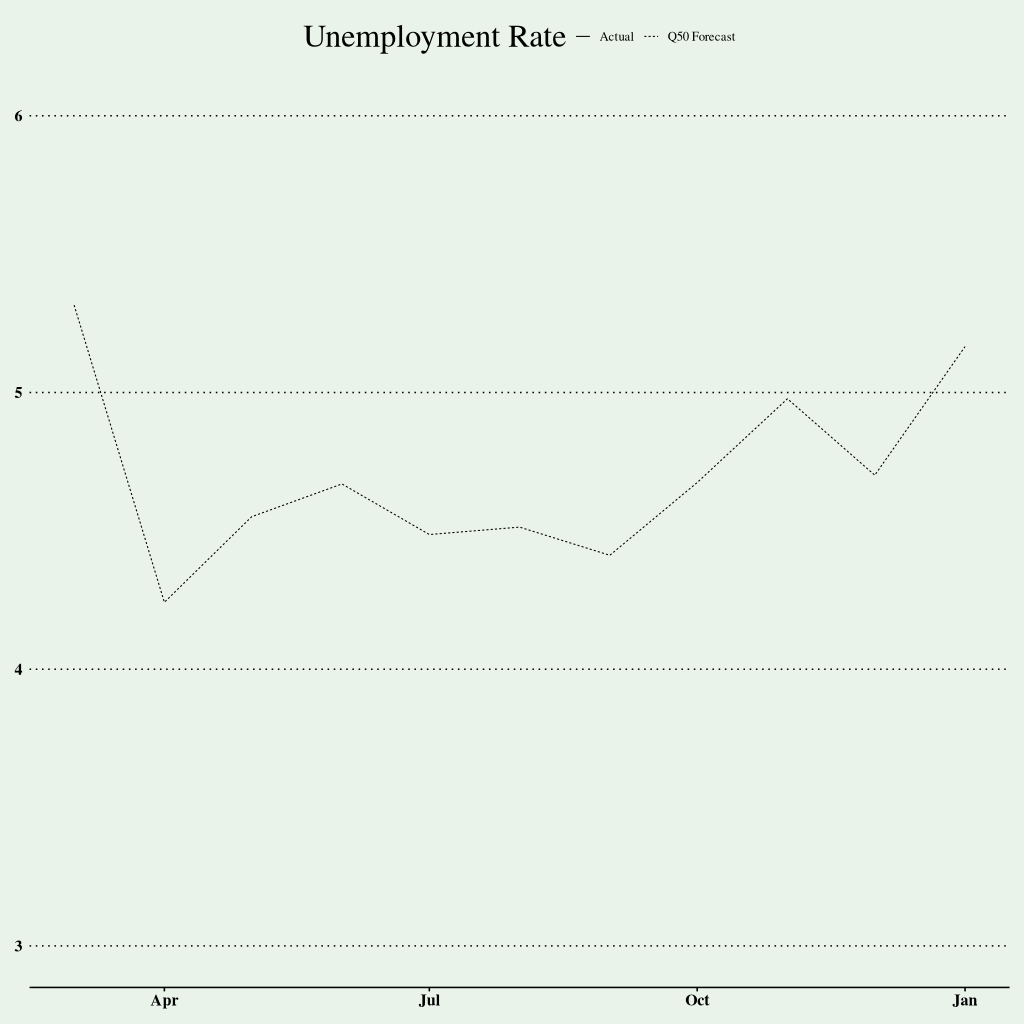
| Date | Actual | Mean | Q10 | Q25 | Q50 | Q75 | Q90 |
|---|---|---|---|---|---|---|---|
| 2026-03-01 | X | 5.4 | 4.9 | 5.1 | 5.3 | 5.6 | 5.9 |
| 2026-04-01 | X | 4.3 | 3.9 | 4.1 | 4.2 | 4.5 | 4.7 |
| 2026-05-01 | X | 4.6 | 4.2 | 4.4 | 4.6 | 4.7 | 4.9 |
| 2026-06-01 | X | 4.7 | 4.3 | 4.5 | 4.7 | 4.9 | 5.1 |
| 2026-07-01 | X | 4.5 | 4.1 | 4.3 | 4.5 | 4.7 | 4.9 |
| 2026-08-01 | X | 4.6 | 4.2 | 4.3 | 4.5 | 4.7 | 4.9 |
| 2026-09-01 | X | 4.4 | 4.0 | 4.2 | 4.4 | 4.6 | 4.8 |
| 2026-10-01 | X | 4.7 | 4.2 | 4.4 | 4.7 | 5.0 | 5.3 |
| 2026-11-01 | X | 5.0 | 4.4 | 4.7 | 5.0 | 5.3 | 5.7 |
| 2026-12-01 | X | 4.8 | 4.4 | 4.5 | 4.7 | 4.9 | 5.2 |
| 2027-01-01 | X | 5.2 | 4.6 | 4.9 | 5.2 | 5.5 | 6.0 |